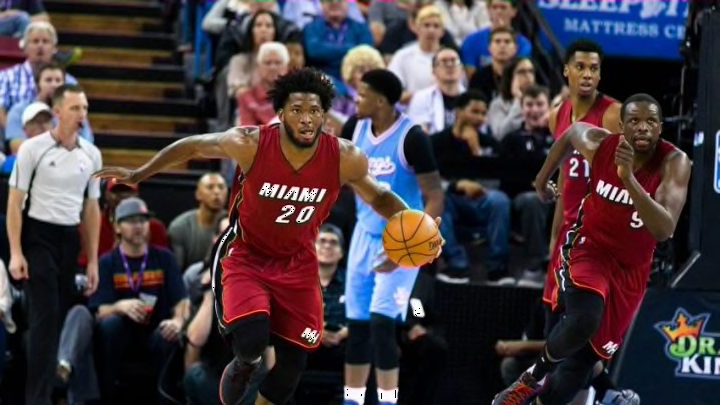
If the Miami Heat can replicate some of last season’s numbers, there is reason to believe they can be just as successful.
In his seminal book on basketball analytics, Basketball on Paper, Dean Oliver provides a method to predict a team’s win-loss record. Oliver’s predictions are based on modeling the difference between points scored and points allowed using a bell curve.
It turns out Oliver’s model is pretty good. Last year, the Miami Heat scored an average of 100.0 points per game and they allowed an average of 98.4 points per game. Oliver’s method predicts the Heat should have won 55 percent of their games, which would have resulted in a record of 45-37. The team’s actual record was 48-32, getting it right within three games.
What’s more interesting is looking at the Heat before and after the all-star break.
Before the break, the Heat were averaging 96.0 points while allowing an average of 96.3 points. Based on Oliver’s method, the Heat should have won 49 percent of their games. This would have resulted in a 26-27 record going into the All-Star break. In reality, the Heat went 29-24, thus outperforming expectations based on point differentials.
Had the Heat continued to play the same way, it’s likely the law of averages would have caught up and the Heat would have underperformed for some period. Based off point differential, the pre-All-Star break Heat should have finished 40-42, and missed the playoffs.
But, something changed.
After the break, the Heat scored an average of 107.4 points per game, while allowing an average of 102.2 points. Oliver’s method predicts the Heat should have won 19 of their remaining 29 games for a 65 percent win rate. The Heat performed exactly in line with expectations, going 19-10 down the stretch.
What was the difference in the second half of the season? Just prior to the All-Star break, coach Erik Spoelstra tweaked the offense. Everyone knows that he wanted the team to play faster, but did he do anything else?
In addition to predicting team records, Oliver discusses four fundamental factors that impact the final score of a basketball game. By looking at these factors, it’s possible to see the tale of a game or a team. These factors are effective field goal percentage, offensive rebounds, free throw rate, and turnovers. Looking at how the Heat (and their opponents) fared by these metrics before and after the break is revealing.
| GP | Pace | eFG% | FTA Rate | TO Ratio | OREB% | |
| Pre All-Star | 53 | 94.7 | 49.9% | 0.28 | 15.0 | 21.9% |
| Post All-Star | 29 | 97.7 | 2.3% | 0.28 | 14.0 | 27.4% |
We can break down the offensive improvements into points. By my back of the envelope estimates, the increased pace accounted for an additional 2.2 points per game. The improved shooting accounted for 2.4 points per game. Decreasing turnovers added 0.7 points per game, while improved offensive rebounding added about 4.3 points per game.
Of the factors, offensive rebounding stands out the most. The team’s rebounding increased by nearly six percent before and after the break. The improved offensive rebounding indicates a conscious decision by the team to attack the offensive glass. At the same time, the team’s defense showed little deterioration.
| Opp | Opp | Opp | Opp | |||
| GP | Pace | eFG% | FTA Rate | TO Ratio | OREB% | |
| Pre All-Star | 53 | 94.7 | 48.50% | 0.241 | 13.5 | 21.60% |
| Post All-Star | 29 | 97.7 | 48.70% | 0.28 | 13.1 | 23.20% |
Most of the increase in the opponents points per game can be attributed to the increased pace and increased fouling by the Heat. They also gave up 1.6 percent more rebounds as they attempted to get out in transition more.
With younger, more athletic players on the team, the Heat should be able to play a style similar to last season’s post All-Star break. Hopefully, they can get similar results.
