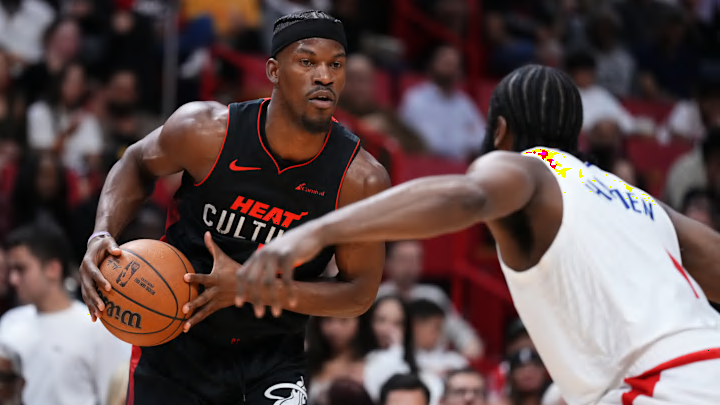
The Miami Heat will resume their season Friday night in New Orleans looking to improve on their 30-25 record and seventh-place standing in the Eastern Conference.
Before looking ahead, now is a good time to take stock of the season and how we got here. Here are five important Heat stats that explain the season so far and can help predict what comes next.
Shot distribution before and after Terry Rozier
A lot was made of Terry Rozier’s rim pressure after the Heat traded for him last month but the stats, at first glance, don’t bear much fruit in terms of a noticeable difference. With or without Rozier, the Heat tend to generate less than a third of their shots at the rim.
But go beyond that number and you can start being able to tell a difference.
The biggest change in Miami’s shot profile since swapping Kyle Lowry for Rozier is in their generation of corner 3s. Before the trade, the Hat ranked 15th at 8.8 corner 3-point attempts per game. Since the deal, they are averaging 11.7 attempts from the corner per game. That’s good for the fourth-most during that stretch and would rank first in the league for the whole season.
Rozier is a big reason for the juiced numbers. He doesn’t take as many shots as he did in Charlotte, but he’s getting into the paint just as much and setting up his new teammates for open looks that Lowry simply could not generate.
In this clip, Rozier gets into the paint before kicking out to Josh Richardson for an open 3-pointer. Rozier doesn’t get credit for a rim attempt, but Richardson’s open shot came from drawing multiple defenders with his paint penetration.
As we saw in last year’s Finals runs, the Heat can be dangerous when those corner 3s are falling. Adding Rozier to Jimmy Butler and Bam Adebayo, two players who created most of Miami’s corner 3s in the past, doubles down on a team strength.
